Wildlife populations have fallen 73% since 1970. The data also shows where they are coming back
WWF and ZSL's new Living Planet Index tracks 35,803 populations of 5,790 species. Greenly charted the full series: freshwater species are collapsing fastest, the uncertainty is wider than the headline suggests, and some species, including Nepal's tigers, have more than tripled.
By Samarth DhamaniPublished 15 October 20268 min read
−73%Average change in monitored wildlife populations, 1970–2022
−85%Freshwater populations, the steepest of any ecosystem
2.5%Average decline per year, compounded over 52 years
3.5×Nepal's wild tigers since 2009, from 121 to 429
Figure 1
The global Living Planet Index, 1970–2022
Average change in monitored vertebrate populations, indexed to 1970 = 100. Shaded area: 95% confidence interval.
Central estimate95% confidence interval
Source: WWF & ZSL, Living Planet Index 2026, via Our World in Data. Chart: Greenly.View the data
The world's monitored wildlife populations have shrunk by an average of 73% since 1970, according to the Living Planet Report 2026, published on 8 October by WWF and the Zoological Society of London (ZSL).1 The index behind that figure follows 35,803 population trends covering 5,790 species of mammals, birds, fish, reptiles and amphibians, 967 more populations and 295 more species than the 2024 edition.1
Greenly charted the full yearly series, which WWF and ZSL publish through Our World in Data.2 The global index fell below half its 1970 level in 1998, and has declined by about 2.5% a year on average since 1970, compounded. Its central estimate for 2022 is 0.268: a typical monitored population is about a quarter of its 1970 size.
The estimate comes with real uncertainty. The 95% confidence interval runs from 0.217 to 0.327, meaning the decline is somewhere between 67% and 78%. The headline 73% is the middle of that range, not an exact measurement.
"Nature loss is not just a crisis for wildlife. It's already sending us the bill through growing risks to our food security, water supplies, economy and resilience to climate shocks."
Split by ecosystem, freshwater populations fell by an average of 85%, land populations by 69% and marine populations by 59%.1 Freshwater dropped below half its 1970 level in 1990, eight years before the global index, and has declined at roughly 3.6% a year.
Rivers, lakes and wetlands are under pressure from several directions at once: dams and water extraction change how much water flows, while pollution and drainage degrade what is left. Greenly's interactive story on Iraq's Mesopotamian Marshes shows that pattern on a single landscape, drained to about a tenth of their size by 2002 and then partly reflooded.
Figure 2
Freshwater populations have fallen furthest
Living Planet Index by system, 1970 = 100.
FreshwaterTerrestrialMarine
Source: WWF & ZSL, Living Planet Index 2026, via Our World in Data. Chart: Greenly.View the data
The uncertainty is uneven
By region, the steepest average declines were in Latin America and the Caribbean (95%) and Africa (80%), followed by Asia–Pacific (49%), North America (28%) and Europe and Central Asia (23%).1
The confidence intervals add a layer the headline numbers leave out. Africa's is wide, spanning anything from a 57% to a 91% decline; a wider interval reflects fewer or more variable population records. North America's upper bound is 1.05, slightly above its 1970 level, so at the 95% level the data cannot rule out no overall change there.
Each edition of the index is recalculated from 1970 with new data, so editions should not be compared directly. Asia–Pacific's average decline was reported as 60% in the 2024 edition and 49% in this one; North America's was 39% then and 28% now.8 Those differences mostly reflect a bigger, revised dataset, not a sudden recovery.
Figure 3
Every region has declined on average, but the confidence ranges differ widely
Living Planet Index in 2022 by region (1970 = 100). Dot: central estimate. Line: 95% confidence interval.
Source: WWF & ZSL, Living Planet Index 2026, via Our World in Data. Chart: Greenly.View the data
An average, not a body count
The 73% is easy to misread. It does not mean 73% of the world's animals are gone, and it does not mean 73% of populations are declining. It is an average of how much each tracked population has changed.
How the index is calculated
For every monitored population, the change in abundance from one year to the next is measured on a log scale, dt = log10(Nt / Nt−1). Gaps between surveys are filled by modelling the trend.9
Those changes are averaged within each species, then across species, giving more weight to regions and animal groups that contain more species overall.10
The yearly averages are chained together from a starting value of 1 in 1970:It = It−1 × 10d̄t
Confidence intervals come from bootstrapping: repeatedly resampling the species and recalculating the index.9
Because the changes are averaged on a log scale, a population that falls tenfold and another that grows tenfold cancel each other out exactly.
Our World in Data's analysis of the 2024 edition shows what that average conceals. Of the 34,836 populations tracked then, 50% were declining, 43% were increasing and 7% were stable.3 For the average to fall by 73% anyway, the declining populations must on the whole have fallen much further than the growing ones have risen.
Figure 4
Half of tracked populations were declining, but 43% were growing
Share of the 34,836 populations in the 2024 edition of the Living Planet Index, by direction of trend.
DecliningStableIncreasing
Source: Ritchie & Spooner, Our World in Data (2024), from Living Planet Index 2024. Chart: Greenly.View the data
The recoveries
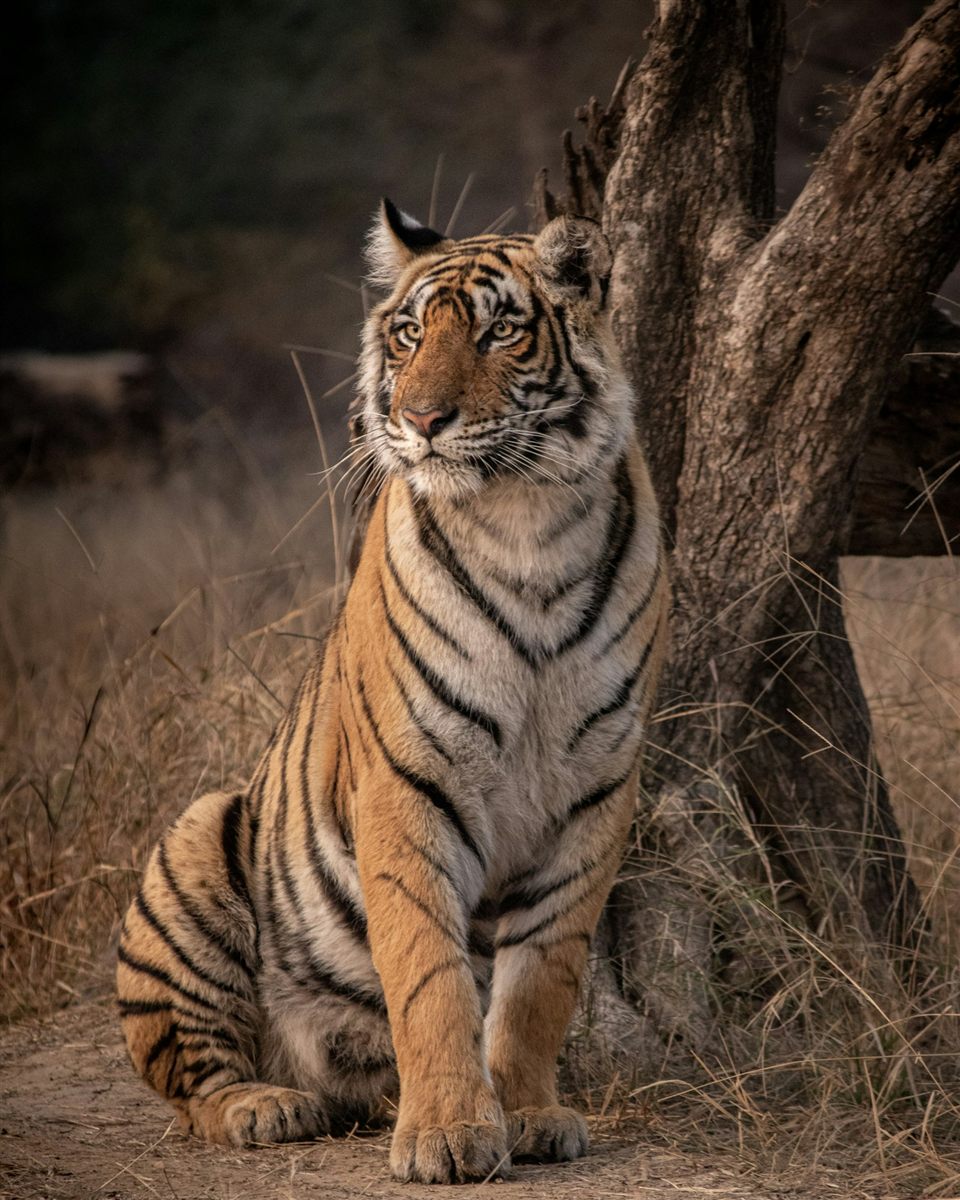
A wild tigress in Ranthambore Tiger Reserve, Rajasthan, India. Global wild tiger numbers rose by more than 70% between 2010 and 2025. Photo: Kartik Iyer / Unsplash.
Alongside the losses, WWF's report highlights species that have recovered. Global wild tiger numbers rose by more than 70% between 2010 and 2025, from about 3,200 to around 5,700.1
Nepal shows how that happened in one country. It was the first to meet the 2010 pledge to double wild tiger numbers by 2022, and its July 2026 census counted 429 tigers, up from 121 in 2009.4,5,7 Every national park recorded an increase except Bardiya, which fell from 125 to 112; Chitwan now has 145.4 "The reason behind the increasing number of tigers is because we could keep their habitat secure," Hari Bhadra Acharya, an ecologist at Nepal's conservation department, said.5
Recovery has costs as well. Government figures show at least 38 people were killed in tiger attacks in Nepal between 2019 and 2023.5
Figure 5
Nepal more than tripled its wild tiger population
Estimated wild tigers in Nepal, by national census year.
Two of those recoveries overlap with Greenly's own reporting. Chitwan is where Himalayan Nature worked with a local community to cut invasive plant cover on 120 hectares of rhino grassland. And in Dubai, the Dubai Turtle Rehabilitation Project has rescued, rehabilitated and released more than 2,350 sea turtles since 2004.
"Positive tipping points"
The report borrows a term usually reserved for climate disasters. A tipping point is a threshold after which change becomes self-reinforcing. WWF argues the same can happen in a good direction, and that it already has in energy: "the falling price of solar, wind and battery power is driving sweeping changes away from fossil fuels," it says, and "having passed the tipping point, the transition to renewable energy looks unstoppable."1 Food production is the next system it says needs to tip.
"Nature's decline is not inevitable. It's the sum of our choices, and these choices can tip."
The UN biodiversity conference, CBD COP17, runs from 19 to 30 October 2026 in Yerevan, Armenia.11 Governments will review progress on the Kunming-Montreal Global Biodiversity Framework, agreed in 2022, whose targets include protecting 30% of the world's land and ocean by 2030.12 Negotiations are expected to focus on biodiversity finance, monitoring and accountability.11
The Living Planet Index is one of the measures governments can use to judge whether those targets are working. For now, it shows a planet where losses still far outweigh gains, and a handful of species that prove the trend can be reversed where protection is sustained.
About this analysis. Figures 1–3 use the Living Planet Index 2026 as published by Our World in Data (last updated 30 September 2026), rebased so that 1970 = 100. Average annual rates of decline were calculated by Greenly as 1 − I20221/52. Figure 4 uses the 2024 edition because Greenly could not find a published breakdown of increasing and declining populations for 2026. Every chart's data can be viewed in a table or downloaded as CSV.
Sources
WWF-UK, "Living Planet Report 2026," press release, 8 October 2026 (including quotes from Tanya Steele and Dr Steve Smith).