The 2026 El Niño is on course to be the strongest ever measured. Here is what the data shows
NOAA now gives an 83% chance that this El Niño will beat every event since 1950. Greenly charted 76 years of NOAA's records: how 2026 compares with the giants of 1982, 1997 and 2015, why scientists changed the way they measure it, and why the world's next record-hot year is likely to follow.
By Samarth DhamaniPublished 16 October 20269 min read
83%NOAA's chance the event sets a new record by October–December
+2.40°CThe record to beat, set in the winter of 1982–83
+1.69°C2026's July–September reading, second only to 1997 at this stage
29.70°CCentral Pacific sea surface in September, the highest monthly value on record
The warming of the tropical Pacific that began in spring has become one of the most powerful El Niño events in modern records. On 8 October, the US National Oceanic and Atmospheric Administration (NOAA) said El Niño "continues to strengthen", with a strong-to-very strong event likely through January–March 2027.1 It put the chance that the event exceeds every El Niño since 1950 at 54% for September–November, 83% for October–December and 70% for November–January.1,2
Other agencies agree on the direction. The UK Met Office said on 22 September that sea surface temperatures in the central equatorial Pacific had "surpassed levels recorded during any previous event."4 Europe's Copernicus Climate Change Service reported that the key monitoring area, the Niño 3.4 region, averaged 29.70°C in September, its highest monthly value on record.5
El Niño is the warm phase of a natural cycle in the tropical Pacific. Trade winds weaken, warm water spreads east towards the Americas, and the shift reorganises rainfall and storm patterns far beyond the Pacific. Greenly charted NOAA's complete record, 76 years of three-month readings, to see how 2026 compares.
Figure 1
76 years of El Niño and La Niña
NOAA's Relative Oceanic Niño Index (RONI), three-month seasons, December–February 1950 to July–September 2026. Above zero: warmer than normal relative to the rest of the tropics.
Strong El Niño (≥ +1.5)El Niño (≥ +0.5)NeutralLa Niña (≤ −0.5)Strong La Niña (≤ −1.5)
Source: NOAA Climate Prediction Center, RONI data. Chart: Greenly.View the data
Measuring El Niño in a warming ocean
For decades, El Niño was measured with the Oceanic Niño Index (ONI): how much warmer than normal the Niño 3.4 region of the Pacific is. That approach has a growing problem. The whole tropical ocean is warmer than it used to be, so some of the heat in the Niño 3.4 region has nothing to do with El Niño. As NOAA explained in its October update, "part of that warm anomaly is due to things besides El Niño," including global warming.2
How NOAA measures El Niño now
The traditional index (ONI) is the three-month average sea surface temperature anomaly in the Niño 3.4 region, roughly 5°N–5°S and 170°W–120°W.3
The relative index (RONI) subtracts the average anomaly across the whole tropics from that, so it measures how much warmer the Niño 3.4 region is than its surroundings, which is what actually drives El Niño's effects on the atmosphere.2
An El Niño is declared when the index stays at +0.5°C or more. Readings above +1.5°C are commonly called strong, and above +2.0°C very strong. NOAA's record threshold for this event is a three-month RONI of +2.5°C.1
The difference matters for this event. For July–September 2026, the traditional index was +2.16°C, but the relative index was +1.69°C.3 On the old measure, 2026 already looks like a record-breaker for the time of year. On the new one, it is still building towards one. Figure 2 shows how the gap between the two has grown as the tropics have warmed.
Figure 2
The tropics have warmed, so the old index increasingly overstates El Niño
Annual average of the traditional index (ONI) minus the relative index (RONI). A rough gauge of background warming across the tropical oceans. 2026 covers January–September.
Source: NOAA Climate Prediction Center, ONI and RONI data. Calculation and chart: Greenly.View the data
The record it has to beat
On the relative index, three El Niño events stand above all others: 1982–83, which peaked at +2.40°C in December–February, 1997–98 at +2.28°C and 2015–16 at +2.25°C.3 No event since 1950 has reached NOAA's +2.5°C threshold. If 2026 does, it will not just edge past the record but clear it.
Figure 3
The strongest El Niño events since 1950
Peak three-month RONI reached by each El Niño episode. 2026–27 shows its value so far; NOAA expects it to keep strengthening through the end of the year.
Source: NOAA Climate Prediction Center, RONI data. Episodes defined by Greenly as consecutive seasons at +0.5°C or above. Chart: Greenly.View the data
What makes 2026 stand out is how early it got strong. Lined up season by season, 2026's July–September reading of +1.69°C is second only to 1997 (+1.84°C) at the same stage, and ahead of 2015 (+1.54°C).3 The current record-holder started slowly: in July–September 1982 it stood at just +1.14°C, then surged through the northern winter. El Niño events usually peak between November and January, so the next three months decide the record.
Figure 4
2026 is tracking the strongest events on record
RONI season by season, from May–July of the starting year to April–June of the next. 2026 data runs to July–September.
2026–271997–981982–832015–16
Source: NOAA Climate Prediction Center, RONI data. Chart: Greenly.View the data
Figure 5
NOAA's odds of a record-breaking El Niño
Probability that the three-month RONI reaches +2.5°C or more, from NOAA's 8 October 2026 forecast. NOAA gives a 100% chance the event is already very strong by September–November.
El Niño's reach is already visible. NASA satellites show sea levels in parts of the eastern Pacific 30 to 40 centimetres higher than normal, as warm water piles up, and 15 to 20 centimetres lower near Indonesia and northern Australia.7 "El Niño touches almost all of us in some way every time it occurs," said Josh Willis, a sea level scientist at NASA's Jet Propulsion Laboratory.7
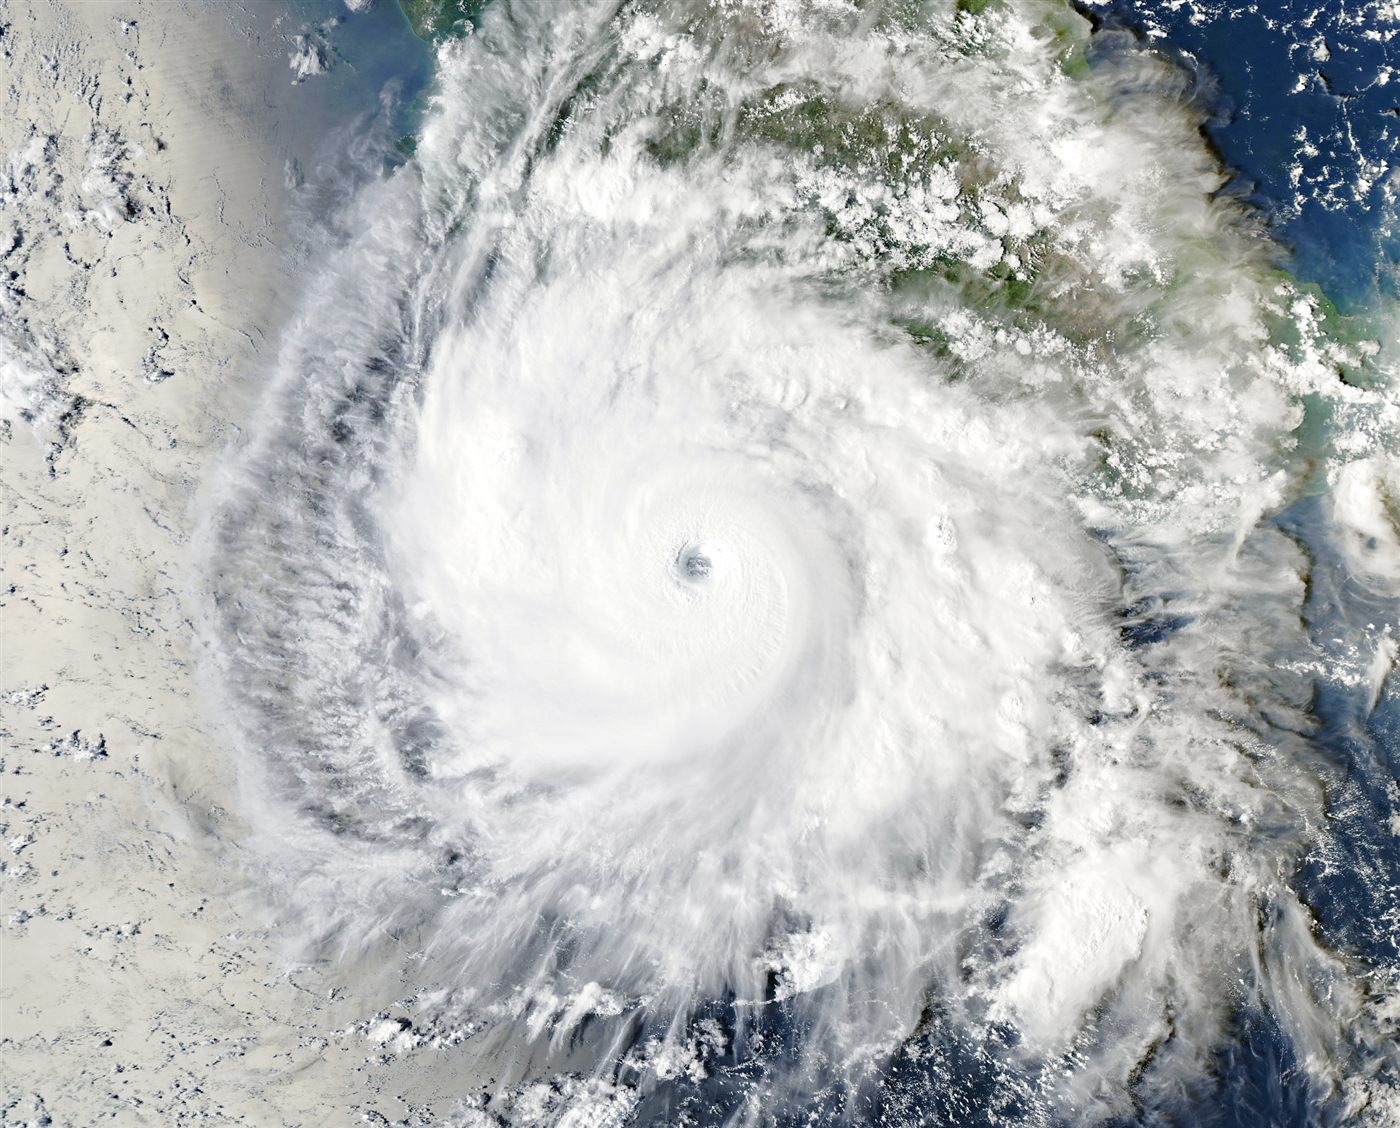
Hurricane Polo off Mexico's Pacific coast on 23 September 2026, shortly after explosive intensification. It became the longest-lasting Category 5 storm on record in the Pacific. Image: NASA Earth Observatory / Michala Garrison, MODIS data.
The clearest example so far is Hurricane Polo, which reached Category 5 on 22 September. A rapid study by World Weather Attribution and Climate Central, published on 15 October, examined the ocean and atmospheric conditions that fuelled it.6 It found that climate change made those conditions about 23 times more likely and El Niño about 14 times more likely, with climate change adding roughly 5 metres per second to the storm's potential wind speed and El Niño about 4.2. The study has not yet been peer-reviewed. Polo made landfall in Baja California Sur on 28 September and mainland Mexico the next day; four people died in floods in Jalisco and one in Sonora.6
Strong El Niño events release heat from the ocean into the atmosphere, briefly raising global temperatures on top of the long-term warming trend. In Copernicus' global temperature record, seven years since 1998 have set a new all-time high, and six of them followed an El Niño winter, including 1998, 2016 and 2024, the warmest year so far. The one exception, 2023, was the year the 2023–24 El Niño began (Figure 6).9
Figure 6
New temperature records tend to follow El Niño winters
Global average surface temperature, difference from the 1991–2020 average, 1951–2025. Each year is coloured by the El Niño state of its December–February winter.
Strong El Niño winterEl Niño winterNeutralLa Niña winter
Sources: Copernicus ERA5, via Our World in Data; NOAA CPC RONI. Chart: Greenly.View the data
The effect is already showing. September 2026 was 1.63°C above pre-industrial levels, the second-warmest September on record, and the sea surface between 60°S and 60°N set a September record of 21.05°C.5
"We are in a new run of months above 1.5°C, and with a strong El Niño still intensifying it is likely to last into 2027."
Carlo Buontempo, Director, Copernicus Climate Change Service5
The Met Office expects the full effect next year. "2027 is very likely to replace 2024 as the warmest year on record," said Dr Nick Dunstone, a Met Office Science Fellow, adding that it is expected to be "yet another year to temporarily exceed +1.5°C above the pre-industrial period."4 El Niño also speeds up the rise of carbon dioxide in the air, because drought and fire reduce how much carbon tropical forests absorb: the four fastest annual rises in Mauna Loa's record all came in El Niño years. Greenly's analysis of the 2026 State of the Climate report looks at that record in detail.
What to watch
NOAA's next El Niño update is due on 12 November 2026.1 If the October–December relative index reaches +2.5°C, the 2026–27 event will become the strongest El Niño in NOAA's records. A temporary El Niño boost does not change the long-term trend underneath it: each strong event now starts from a warmer baseline than the last.
About this analysis. Figures 1–4 and 6 use NOAA CPC's RONI and ONI series as published on 16 October 2026; the latest three-month value is July–September 2026. El Niño episodes in Figure 3 are runs of consecutive seasons with RONI at +0.5°C or above, ranked by their peak. Figure 2 averages ONI minus RONI for each calendar year with at least six seasons of data. Figure 6 colours each year by the December–February RONI that begins it. Every chart's data can be viewed in a table or downloaded as CSV.